The Enterprise AI ROI Calculator Guide: How to Measure and Defend AI Investments

Enterprise investments in artificial intelligence have moved past the proof-of-concept phase. Boardrooms no longer approve line-item allocations based on technology optimism or competitive anxiety. Today, Chief Financial Officers (CFOs), Chief Technology Officers (CTOs), and Chief Information Security Officers (CISOs) must defend these budgets with rigorous, defensible, and audited financial models.

Yet, approximately 80% of top-down enterprise AI implementations struggle to prove clear financial returns. This friction occurs because traditional software evaluation frameworks fail when applied to probabilistic systems. Standard methodologies rely heavily on simplistic calculations—multiplying nominal time savings by an average hourly wage. In reality, artificial intelligence does not interact with corporate workflows like static SaaS software.

To accurately assess economic viability, organizations must transition from basic financial estimation tools to a structured AI ROI calculator framework. This comprehensive guide details the mathematical formulas, systemic hidden costs, operational variables, and vertical-specific metrics required to build a corporate-grade evaluation model that withstands intense board scrutiny.

The Traditional ROI Trap: Why Standard Calculators Fail for Artificial Intelligence

Traditional software investments follow a predictable financial trajectory. When an enterprise deploys an Enterprise Resource Planning (ERP) or Customer Relationship Management (CRM) system, the business case is anchored to explicit variables: standard software licensing fees, structured system integration costs, and quantifiable reductions in headcount or legacy software consolidation. The return on investment is linear and discrete.

Evaluating an enterprise AI deployment via these standard vectors creates a flawed baseline. Artificial intelligence introduces non-deterministic outputs, fluctuating compute costs, variable adoption rates, and complex organizational behavioral patterns.

The Leakage of Saved Time

The most critical flaw in basic online calculators is the direct translation of soft time savings into hard cash-flow improvements. Consider a scenario where an enterprise deploys a generative AI tool across a 5,000-employee workforce. If the tool saves an average of 4 hours per week per employee, a basic calculator yields the following calculation:

$$\text{Total Annual Hours Saved} = 5,000 \times 4 \times 52 = 1,040,000 \text{ hours}$$

If the fully burdened labor rate is $65 per hour, the calculator claims a gross annual return of $67,600,000.

In practice, this $67.6M figure is a financial illusion. Unless the enterprise terminates a corresponding percentage of the workforce or structurally reallocates those exact hours to pre-revenue activities, time savings to P&L impact do not automatically convert to a bottom-line cash equivalent. Instead, the reclaimed capacity experiences "time leakage." It dissolves into longer breaks, administrative slack, or lower-value tasks, leaving the net financial position of the enterprise unchanged despite a massive capital layout.

Direct vs. Indirect Value Streams

A robust generative AI business case requires an evaluation model that categorizes returns into discrete, measurable value vectors. Rather than treating all time as equal, an enterprise-grade framework splits returns into direct operational savings and indirect strategic upside.

Enterprise AI Value Stream Framework

  • Direct Value Streams (Quantifiable P&L Impact)
    • Capacity Reclamation & Redirection: Structural redirection of hours into billable work or increased throughput.
    • Vendor Consolidation: Directly retiring redundant legacy SaaS subscriptions.
  • Indirect Value Streams (Strategic Capacity & Quality)
    • Error Rate Reduction: Lower rework requirements and less manual remediation.
    • Accelerated Skill Ramp: Shortened onboarding pipelines for junior staff.
    • Risk & Burnout Mitigation: Lower attrition rates and decreased turnover costs.

1. Capacity Reclamation and Documented Redirection

Reclaimed hours only carry financial value if they alter the financial performance of the firm. This occurs in two ways:

  • Throughput Maximization: The employee produces more high-value output within the same fixed shift (e.g., an insurance claims adjuster processing 14 claims per day instead of 10).
  • Linear Headcount Avoidance: The business scales its operational volume without hiring additional personnel linearly (e.g., a customer support center handling 30% more ticket volume without increasing support agent headcount).

2. Quality Improvement and Error Rate Reduction

AI systems can act as high-fidelity validation layers. In engineering, legal, or financial contexts, the return is calculated by tracking the decline in error rates. The financial savings equal the avoided costs of operational rework, technical debt remediation, or legal penalties.

3. Innovation and Strategic Acceleration

By transferring cognitive grunt work—such as data aggregation, formatting, and initial drafting—to an AI system, senior personnel can redirect their focus toward market analysis, proactive client engagement, and complex strategic planning.

4. Accelerated Skill Ramp and Upskilling

Data across multiple AI implementation benchmarks indicates that generative AI disproportionately assists low-performing and junior employees. By providing an interactive organizational knowledge base, junior staff reduce their time-to-competency. This shifts the internal labor distribution curve upward and compresses onboarding cycles.

5. Employee Retention and Burnout Mitigation

Automating highly repetitive, low-cognitive-load administrative tasks improves worker sentiment in high-stress roles (e.g., healthcare charting, cybersecurity alert triaging, customer service). The financial model captures this via reduced employee turnover expenses, lowered recruitment costs, and decreased reliance on contract labor.

The Core Mathematics: How an AI ROI Calculator Works

To build a defensible business case, financial analysts must convert these operational realities into formal mathematical algorithms. An enterprise AI ROI framework cannot rely on static variables; it must process dynamic parameters that account for scaling costs and human friction.

Mathematical Formulas

The fundamental Net Present Value ($NPV$) and Return on Investment ($ROI$) calculations for an enterprise AI deployment are governed by the following mathematical equations:

$$\text{Gross Financial Return } (R_t) = \sum \left( (C_{\text{rec}} \times R_{\text{burdened}} \times E_{\text{ceil}}) + V_{\text{saved}} + Q_{\text{gain}} \right)$$

$$\text{Total Enterprise Investment } (I_t) = C_{\text{licensing}} + C_{\text{compute}} + C_{\text{integration}} + C_{\text{governance}} + C_{\text{change\_mgmt}}$$

$$\text{Net Present Value } (NPV) = \sum_{t=1}^{n} \frac{R_t - I_t}{(1 + r)^t} - I_0$$

$$\text{AI Return on Investment } (ROI) = \left( \frac{\sum_{t=1}^{n} (R_t - I_t)}{I_0 + \sum_{t=1}^{n} I_t} \right) \times 100$$

Where:

  • $C_{\text{rec}}$ = Realized Reclaimed Capacity (Total hours per year structurally redirected to measurable economic activity).
  • $R_{\text{burdened}}$ = Fully Burdened Hourly Rate of the impacted cohort (base salary + benefits + equity + overhead).
  • $E_{\text{ceil}}$ = Adoption Ceiling (The percentage of the target workforce actively and correctly utilizing the system at steady-state).
  • $V_{\text{saved}}$ = Hard savings achieved from decommissioning legacy software vendors.
  • $Q_{\text{gain}}$ = Audited financial gain from error reduction, regulatory avoidance, or net new throughput value.
  • $I_0$ = Upfront Year 0 capital expenditure.
  • $r$ = The corporate hurdle rate or weighted average cost of capital (WACC).

Defining the Variables

Inputs & Labor Metrics

  • Target Workforce Cohort: The specific employee population receiving access to the AI tool (e.g., 800 software engineers, 1,200 customer support agents).
  • Fully Burdened Labor Rate: This must incorporate all corporate overhead costs, not just raw payroll numbers.
  • Adoption Ceiling ($E_{\text{ceil}}$): The realistic utilization cap. Assuming 100% user adoption across an enterprise is a major modeling error. Year 1 deployments typically top out between 35% and 60% due to cultural friction, data silos, and changing operational habits.

Enterprise AI Deployment Costs

A comprehensive model must track multiple cost vectors that extend far beyond initial software seat licenses:

Software & Infrastructure
  • Seat Licensing Fees: Direct SaaS subscription costs (e.g., Microsoft 365 Copilot, Gemini Enterprise). These are recurring expenses billed annually or monthly.
  • API & Token Usage: Variable compute expenses for custom LLM interactions, processing, and vector database queries. These are variable, usage-based expenses.
  • Compute & Infrastructure: Dedicated cloud instances (GPUs) for hosting private open-weights models (e.g., Llama 3). These count as capital or operational expenses.
Implementation & Engineering
  • System Integration & Fine-Tuning: Custom software development, retrieval-augmented generation (RAG) pipeline assembly, and API connections. This is a one-time, Phase 1 expense.
  • Data Cleaning & Pipeline Prep: Data engineering hours spent structuring unorganized enterprise data, creating vector embeddings, and cleaning access controls. This is an upfront, one-time expense.
Governance & Security
  • Compliance & Auditing: Red-teaming, data privacy checks, vulnerability scans, and AI safety monitoring infrastructure. This is a recurring annual expense.
  • Legal & Insurance Costs: Updated intellectual property indemnification reviews and professional liability insurance adjustments. This is a recurring annual expense.
Human Capital & Process
  • Change Management & Training Overhead: Workforce instructional courses, prompt engineering workshops, and organizational restructuring consultants. This is a mix of one-time and ongoing expenses.
  • Operational Productivity Dip: The temporary drop in employee output during the initial 30-to-60 day system onboarding phase. This is a hidden, one-time expense.

Sample Year 1 Enterprise AI Investment vs. Return Ledger

The following model represents an audited Year 1 ledger for a professional services enterprise deploying a specialized AI knowledge system across a department of 1,000 active consultants (Average fully burdened rate: $90/hr; target capacity redirection: 3 hours/week; assumed Year 1 Adoption Ceiling: 50%).

Year 1 Enterprise AI Ledger (Model Population: 1,000 Users)

Gross Value Creation Vectors

  • Reclaimed & Redirected Capacity: $6,480,000
  • (3 hrs/wk $\times$ 48 wks $\times$ 1,000 users $\times$ 50% adoption $\times$ $90/hr)
  • Document Synthesis Quality Gains: $420,000
  • (Reduced legal/compliance review rework)
  • Consolidation of Legacy Research Tool Subscriptions: $180,000
  • TOTAL GROSS YEAR 1 VALUE GENERATED: $7,080,000

Enterprise Capital & Operational Outlays

  • Upfront Costs (Year 0 / Early Year 1):
    • Data Engineering, RAG Architecture, & Internal Pipeline Setup: $450,000
    • Prompt Engineering and Change Management Program Costs: $250,000
  • Ongoing Operating Costs (Year 1 Continuous):
    • Annual Software Seat Licensing ($40/month/user $\times$ 1,000 users): $480,000
    • Scaled API Token Compute Allocation (Estimated continuous inference): $310,000
    • Security Auditing, Model Drift Tracking, & Governance Infrastructure: $160,000
  • TOTAL ENTERPRISE AI INVESTMENT (YEAR 1): $1,650,000

Final Performance Metrics

  • NET YEAR 1 OPERATIONAL CASH LIFT: $5,430,000
  • NET YEAR 1 ACCOUNTING ROI: 329.09%

Vertical-Specific AI ROI Frameworks

Generic models fall apart because value manifests differently depending on the work being performed. A calculator built for a financial services firm cannot accurately assess a manufacturing or cybersecurity deployment. To achieve topical authority, an ROI model must track vertical-specific performance metrics.

Security Operations (SecOps) & IT Automation

In enterprise security environments, ROI is heavily weighted toward risk mitigation, incident velocity acceleration, and labor optimization.

  • Key Metrics: Mean Time to Detect (MTTD), Mean Time to Respond (MTTR), Alert-to-Analyst Triage Ratio, and False Positive Elimination Rate.
  • Financial Value Calculation: The economic case rests on preventing catastrophic breach expenses and optimizing expensive Tier 1 and Tier 2 SOC analyst resources. By utilizing AI agents to summarize system logs, run automated playbooks, and isolate endpoints, enterprises reduce their reliance on external consultants during incidents.

$$\text{SecOps Annual Savings} = (\Delta \text{MTTR} \times \text{Historical Cost Per Hour of Downtime}) + (\text{Alerts Triaged by AI} \times \text{Marginal Cost of Manual Triage})$$

Enterprise Resource Planning (ERP) & Manufacturing

Industrial settings shift the focus away from text generation and direct it toward operational predictive intelligence, asset tracking, and supply chain network management.

  • Key Metrics: Overall Equipment Effectiveness (OEE), Unscheduled Equipment Downtime, Inventory Turnover Ratios, and Supply Chain Sourcing Variance.
  • Financial Value Calculation: AI systems process IoT sensor telemetry data to forecast machinery wear before catastrophic failure occurs. Preventing an unscheduled production halt avoids idle assembly labor costs, protects client delivery agreements, and lowers component repair expenses.

$$\text{Manufacturing Savings} = (\text{Avoided Downtime Hours} \times \text{Factory Output Margin Value Per Hour}) + (\text{Inventory Carry Cost Reduction})$$

Knowledge Work & Professional Services (Legal, Marketing, Finance)

For professional services organizations, time functions as the primary inventory unit. Maximizing information processing velocity directly drives profitability.

  • Key Metrics: Document Draft Velocity, Contract Line-Item Auditing Speed, Automated Invoice Reconciliation Rates, and Content Localization Turnaround.
  • Financial Value Calculation: In billable corporate structures (e.g., law firms, specialized consultancies), the metric scales on the leverage ratio—allowing junior professionals to perform baseline legal discovery or contract preparation in a fraction of historical hours, maintaining output quality while scaling volume. In corporate finance, the return is calculated via the reduction of payment cycles and the elimination of manual human entry errors in ledger tracking.

$$\text{Knowledge Work Value} = (\text{Volume of Document Outputs} \times \Delta \text{Production Speed} \times \text{Blended Labor Rate}) - \text{Model Review Cost}$$

Step-by-Step: Building an Internal AI ROI Assessment Model

To deploy a bulletproof AI ROI calculator framework internally, corporate teams should follow a structured four-stage implementation methodology.

┌─────────────────────────────────┐      ┌─────────────────────────────────┐
│ STEP 1: Baseline Benchmarking   │ ───► │ STEP 2: Isolate Cohort Testing  │
│ Track core metrics sans AI.     │      │ Measure real shift vs. control. │
└─────────────────────────────────┘      └─────────────────────────────────┘
                                                         │
                                                         ▼
┌─────────────────────────────────┐      ┌─────────────────────────────────┐
│ STEP 4: Project Infrastructure  │ ◄─── │ STEP 3: Apply Finance Discount  │
│ Model token scaling & drift.    │      │ Strip out subjective metrics.   │
└─────────────────────────────────┘      └─────────────────────────────────┘

Step 1: Benchmark Baseline Time-to-Task Metrics

Before installing a single enterprise software license, companies must document baseline operational performance. This step requires gathering clean, objective data on how long specific tasks take using legacy software stacks.

  • Document the hours needed to draft an RFP response, generate a codebase feature update, or handle customer ticket tier 2 escalations.
  • Ensure these baseline calculations capture end-to-end cycles, including wait states, management reviews, and iterative edits.

Step 2: Implement a Phased Deployment to Isolate Productivity Lift

Avoid big-bang enterprise rollouts. Instead, run isolated control group trials to accurately measure productivity improvements.

  • Provide AI tools to a treatment group of 100 workers while keeping a matched control group of 100 workers on legacy workflows.
  • Track output volume, error remediation loops, and end product delivery times across both groups over a 60-to-90 day period.
  • Use this empirical difference to establish your real-world productivity multiplier, automatically incorporating the true Year 1 adoption ceiling.

Step 3: Apply a Defensibility Discount for the Finance Team

To gain CFO sign-off, strip out all soft, speculative variables from the final investment presentation.

  • Apply a strict "defensibility discount" (typically 30% to 50%) to any claimed soft efficiency returns to account for time leakage.
  • Remove highly subjective metrics like "improved employee sentiment," "subjective design quality," or "theoretical collaboration gains" from the primary financial ledger.
  • Keep the core model focused entirely on verified cost reductions, hard capacity redirection, and clear risk avoidance vectors.

Step 4: Account for Scaling Costs and Long-Tail Infrastructure Realities

An initial pilot model often fails to reflect steady-state operational realities. Your long-term forecast must account for how system infrastructure costs shift as utilization grows.

  • Build custom models that account for token consumption scaling up non-linearly as workers process larger, more complex files.
  • Budget for ongoing model tuning, vector index adjustments, retrieval quality pipeline upkeep, and data privacy governance audits.
  • Factor in an annual depreciation or performance drift buffer to account for model update cycles, API adjustments, and ongoing system refinement needs.

Frequently Asked Questions About Measuring AI ROI

What does an AI ROI Calculator measure?

An enterprise AI ROI calculator tracks the net financial return of an artificial intelligence investment relative to its total deployment cost. Unlike simple software calculators that focus strictly on time savings, an enterprise-grade calculator models fully burdened labor rates, realistic adoption ceilings, integration engineering costs, change management training overhead, API token consumption fees, and direct time-to-P&L impact vectors.

Why do grassroots, employee-led AI adoptions show higher ROI than strict top-down mandates?

Grassroots adoptions typically yield higher initial ROI metrics because they resolve immediate operational bottlenecks identified by frontline workers. These bottom-up deployments incur minimal software integration costs, zero initial change management friction, and enjoy near-instant local adoption.

Top-down mandates, by contrast, carry massive structural overhead. They require extensive data governance restructuring, major systems integration work, and significant change management budgets to overcome deep organizational inertia and low user adoption.

What is a realistic adoption ceiling for enterprise AI in Year 1?

For large enterprises, a realistic steady-state adoption ceiling for Year 1 is between 35% and 60%. Assuming 100% immediate utilization across an organization is an unrealistic modeling error. Behavioral friction, legacy application habits, unclear data access permissions, and a general lack of structured prompt education keep a large portion of the target workforce from integrating AI systems into their daily habits during the initial 12 months.

How do you calculate the ROI of custom internal AI agents vs. off-the-shelf SaaS solutions?

Calculating the ROI split requires evaluating upfront capital expenditure against long-term variable operational costs.

                Is custom data security or specialized task orchestration required?
                                                │
                       ┌────────────────────────┴────────────────────────┐
                       ▼ YES                                             ▼ NO
        ┌───────────────────────────────┐                 ┌───────────────────────────────┐
        │   Custom Internal AI Agents   │                 │    Off-the-Shelf SaaS Tool    │
        └───────────────────────────────┘                 └───────────────────────────────┘
        │ Upfront CapEx: HIGH           │                 │ Upfront CapEx: LOW            │
        │ Ongoing OpEx: LOW (Tokens/OS) │                 │ Ongoing OpEx: HIGH (Licenses) │
        │ Breakeven: Long-Term Horizon  │                 │ Breakeven: Short-Term Horizon │
        └───────────────────────────────┘                 └───────────────────────────────┘

  • Off-the-Shelf SaaS Solutions require minimal upfront investment ($I_0$) and deliver fast, short-term implementation timeframes. However, they carry high ongoing operational licensing fees that scale linearly with every seat added.
  • Custom Internal AI Agents demand high upfront development costs, extensive data engineering infrastructure, and initial RAG configuration spend. However, they deliver significantly lower long-term marginal running costs by utilizing open-weights models and optimized token processing, proving more cost-effective at massive enterprise scale.

How should a CFO handle "soft" qualitative metrics during a board budget presentation?

A CFO should separate the investment presentation into two distinct financial ledgers:

  1. The Core Financial Model: Built exclusively on verified, auditable cost reductions, legacy vendor retirement, and documented capacity redirection that directly alters the corporate P&L.
  2. The Strategic Upside Ledger: Houses qualitative, soft metrics such as increased employee retention, accelerated junior onboarding speed, and long-term product quality improvements. These are framed as zero-cost call options or strategic bonuses that sit on top of the hard financial baseline rather than serving as the justification for the initial capital layout.

FREE LIVE DEMO: See your ROI in seconds

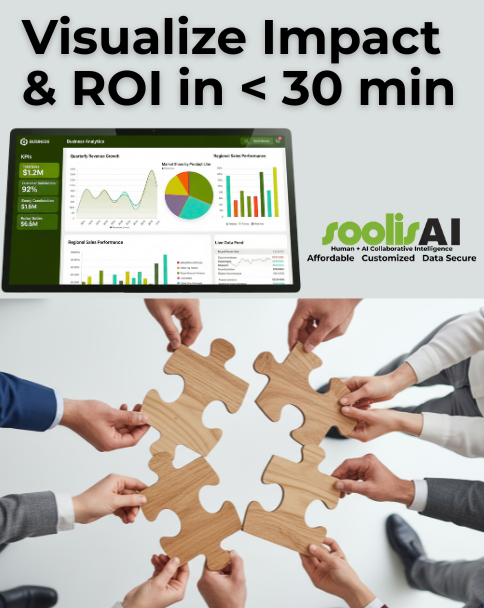
We value your time. Visualize the possibilities < 30 min!

Get started
Thank you! Your submission has been received!
Oops! Something went wrong while submitting the form.